
Historical performance
Our Track Record
What we have returned to clients, and what the catalog has done in the twelve months between Aug 15, 2025 and Aug 14, 2026.
Start Investing- $27,500,000+Capital Returned
- 200,000+Clients
- 1,700,000+Bottles Under Custody
Recent Whiskey Move
Whiskey move
The largest twelve-month price move in the whiskey book, measured from the same snapshot that prices every listing on the marketplace. This is a live listing, not a completed sale. One cask is not a trend: the whiskey book is small, hold times run four to eight years, and past movement says nothing about the next twelve months.
View the listingPrices are the first and last points of this listing's twelve-month series. Hold times and performance vary and are subject to market conditions. Illustrative of one holding only, not a projection.
Biggest Twelve-Month Moves

2014 Agrapart & Fils, Mineral Blanc de Blancs Extra Brut Grand Cru
- 12-Month Move
- +295.0%
- Vintage
- 2014
- Listed
- $1,037

2014 Domaine d'Auvenay, Mazis-Chambertin Grand Cru
- 12-Month Move
- +183.9%
- Vintage
- 2014
- Listed
- $34,604
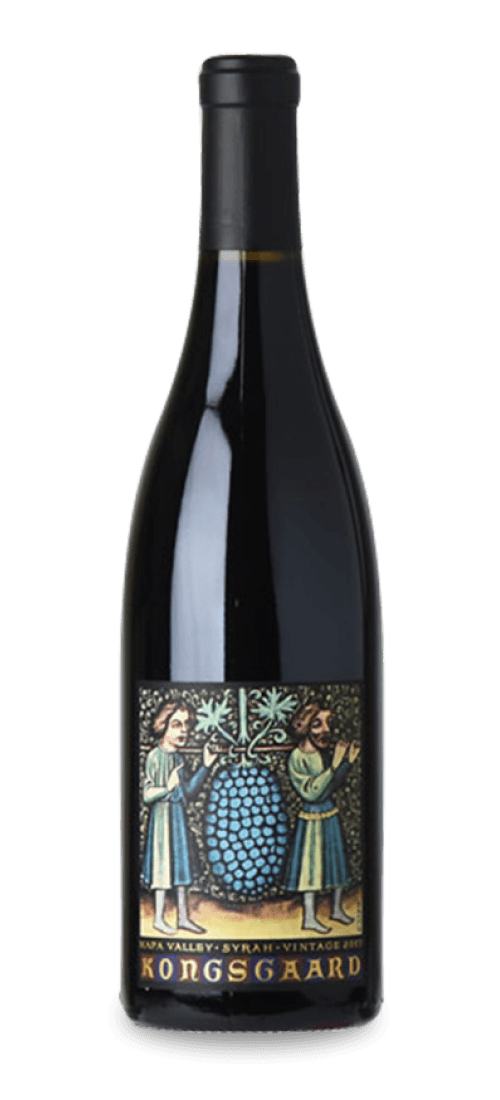
2017 Kongsgaard, Hudson Vineyards Syrah, Napa Valley
- 12-Month Move
- +174.7%
- Vintage
- 2017
- Listed
- $24,514
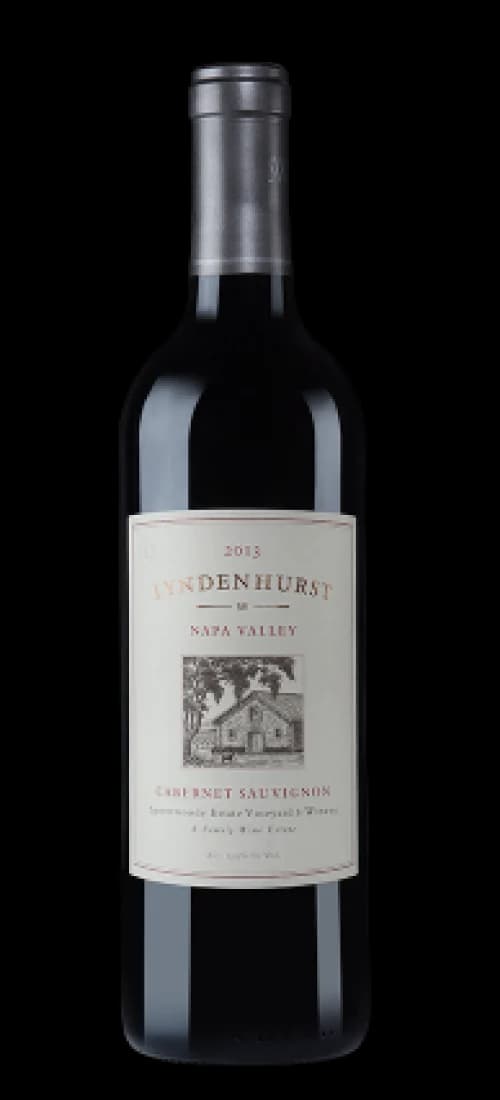
2013 Spottswoode, Lyndenhurst Cabernet Sauvignon, Napa Valley
- 12-Month Move
- +150.9%
- Vintage
- 2013
- Listed
- $2,770
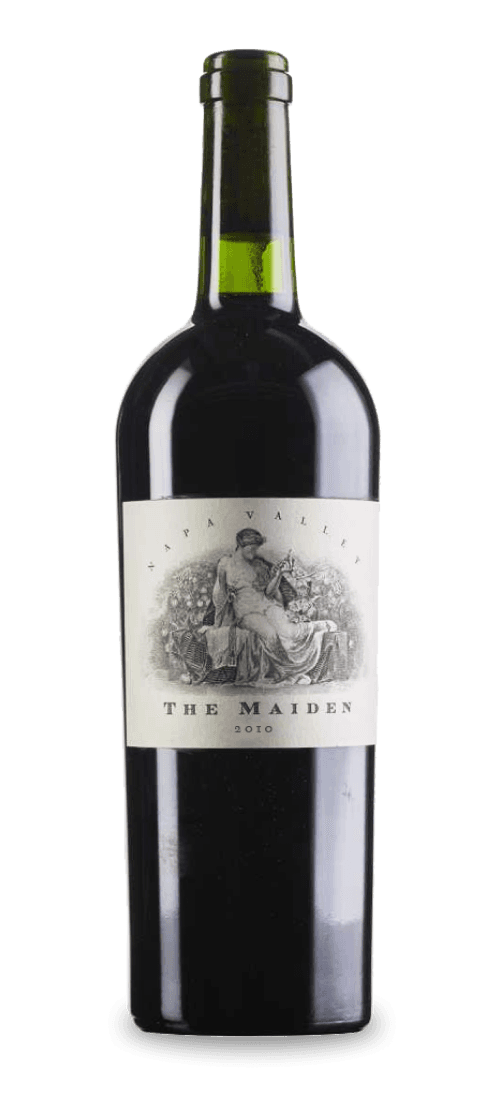
2010 Harlan Estate, The Maiden, Napa Valley
- 12-Month Move
- +132.4%
- Vintage
- 2010
- Listed
- $2,738
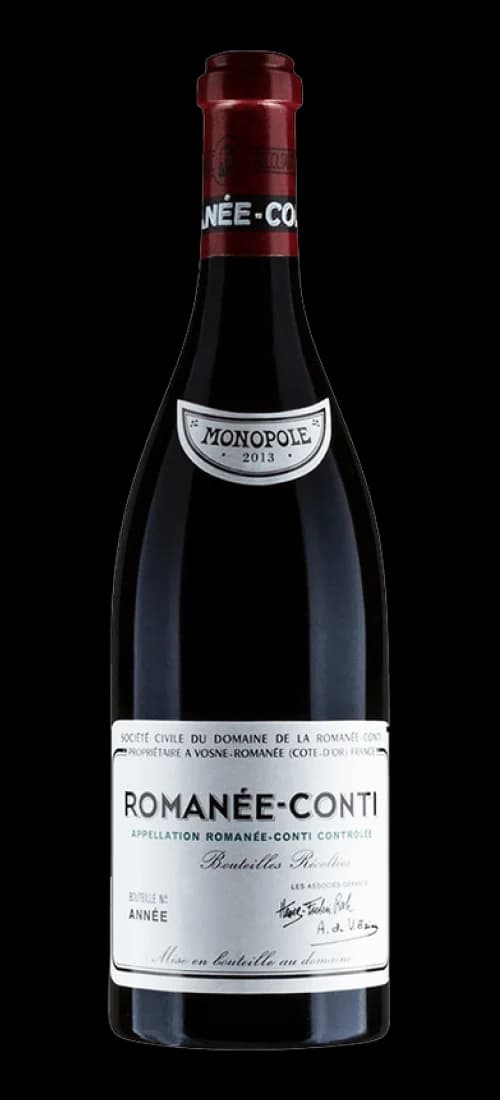
2017 Domaine de la Romanee-Conti, Romanee-Conti Grand Cru
- 12-Month Move
- +127.4%
- Vintage
- 2017
- Listed
- $30,500

2018 Verite, La Joie, Sonoma County
- 12-Month Move
- +121.5%
- Vintage
- 2018
- Listed
- $2,106
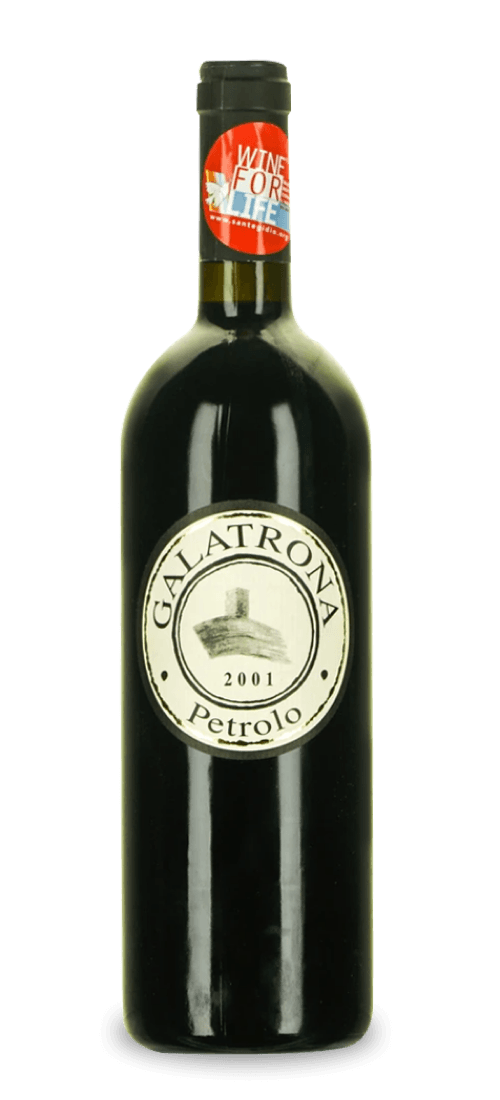
2001 Petrolo, Galatrona, Toscana
- 12-Month Move
- +118.9%
- Vintage
- 2001
- Listed
- $2,001
These are the eight biggest gains out of 4,008 listings, all of them still on the market. Across the whole catalog the median twelve-month move was -1.2% and an equal-weight index of every listing moved -0.7%. Past movement is not indicative of future results, and none of these are completed sales.
Quarterly Market Read
An equal-weight index of every listing with a complete price series, measured at the last reading of each quarter. No weighting by price, no survivorship filter. Quarters outside the snapshot window are marked as not measured rather than filled in.
Quarterly index 2026
- Q4 - 2026Not measured
- Q3 - 2026+2.42% QTD
- Q2 - 2026-0.32%
- Q1 - 2026+0.79%
Quarterly index 2025
- Q4 - 2025-1.82%
- Q3 - 2025Not measured
- Q2 - 2025Not measured
- Q1 - 2025Not measured
The same twelve months, by region
Regions with fewer than thirty listings are left out because the median stops meaning anything. Cask regions barely register: whiskey is revalued on regauge rather than continuously, so a year of it can read as flat.
| Region | Listings | Up | Median | Best |
|---|---|---|---|---|
| Burgundy | 1,275 | 40% | -1.2% | +184% |
| Bordeaux | 730 | 37% | -2.3% | +84% |
| Piedmont | 487 | 28% | -5.7% | +85% |
| California | 323 | 47% | -0.3% | +175% |
| Rhone | 313 | 35% | -2.7% | +81% |
| Tuscany | 311 | 47% | -0.4% | +119% |
| Champagne | 270 | 46% | -0.4% | +295% |
| South Australia | 55 | 38% | -1.6% | +70% |
| Mosel | 52 | 54% | +2.6% | +37% |
| Scotland | 31 | 0% | 0.0% | 0% |
Start investing in minutes
Open an account, make a deposit, and start building your collection.
Past movement is not indicative of future results. Wine and whiskey are collectibles, not securities.